Consistent Alpha, Built on Time Cycles and Risk Discipline
PriceBridge is a Portfolio Management Service (PMS) of Ayan Analytics Pvt. Ltd., built on proprietary TimeMapping and quantitative behavioural analysis to pursue risk-adjusted returns across market cycles—aiming to limit drawdowns during volatility while building long-term investor legacy.
Investments in securities market are subject to market risks. Past performance may or may not be sustained in the future.
The Price Bridge Edge
Five Building Blocks Behind Our Investment Process
Index Stocks & ETFs
Risk regime insights
Across time frames
Execution
Investing approach
WHY PRICEBRIDGE
A New-Age PMS Driven by Proprietary Investment Systems
PriceBridge is principled on risk-adjusted returns with time-cycle based proprietary models. Our approach is designed to stay reliable in volatility, stable in uncertainty, and consistent in process.
Risk insight across time frames to guide disciplined portfolio actions.
A process built for different regimes, not only bull markets.
Focus on limiting drawdowns during volatility through risk discipline.
A curated portfolio with a cost-aware approach.
Investor-friendly structure to reduce friction.
OUR APPROACH
Buy and Hold—Without Timing Markets. With Timed Actions.
We do not advocate timing markets. We believe in timing our actions— guided by TimeMap™ insights of risk across time cycles. Rebalancing weights across different time frames plays a crucial role in generating alpha over a pure buy-and-hold approach.
Proprietary systems based on quantitative behavioural analysis and TimeMapping
Even in low beta, we selectively latch onto momentum for improved outcomes
Objective-driven and reinforcement-led discipline in execution
How It Works
TimeMap™ across timeframes
Disciplined portfolio actions
Behaviour-aware reinforcement loop
STRATEGIES
Five Portfolio Strategies Built for Different Investor Objectives
PriceBridge provides choices across index stocks and ETFs through discretionary portfolio management designed for sustainable, responsible investing.
Multicap
Objective
Absolute returns strategy
Portfolio
Diversified; sector and market-cap agnostic
Key Edge
TimeMap™ guided rebalancing
ETF
Objective
Alpha over index investing using ETFs
Portfolio
Dynamic asset allocation across sectors and market caps
Key Edge
“Passively Active” with TimeMap™ risk models
Small & Midcap
Objective
Growth-oriented, higher volatility tolerance
Portfolio
Small & midcap focus (risk-aware)
Key Edge
TimeMap™ guided small & midcap allocation
Balanced Growth
Objective
Steady growth with balanced risk
Portfolio
Diversified across market segments
Key Edge
Risk-adjusted portfolio construction
Large Cap Focus
Objective
Core equity approach in top 100 universe
Portfolio
Concentrated portfolio of top companies
Key Edge
Quality-focused with TimeMap™ discipline
Not sure which strategy fits your investment objective?
PERFORMANCE
Performance vs Benchmark
As on 31 October 2025 | We publish performance against benchmarks with transparent methodology
| 1M | 3M | 6M | 1Y | 2Y | SI | |
|---|---|---|---|---|---|---|
| PriceBridge Upswing (Multicap) | 1.21% | 1.07% | 7.89% | -1.56% | 13.40% | 13.17% |
| Nifty50 TRI | 4.62% | 4.15% | 6.69% | 7.59% | 17.52% | 13.43% |
Benchmark used: Nifty50 TRI
| 1M | 3M | 6M | 1Y | 2Y | SI | |
|---|---|---|---|---|---|---|
| PriceBridge Honeycomb (ETF) | 4.17% | 7.99% | 13.87% | 9.99% | 19.99% | 16.53% |
| Nifty50 TRI | 4.62% | 4.15% | 6.69% | 7.59% | 17.52% | 15.45% |
Benchmark used: Nifty50 TRI
| 1M | 3M | 6M | 1Y | SI | |
|---|---|---|---|---|---|
| PriceBridge Eternal - LongLife (Small & Midcap) | 2.13% | -0.88% | 8.72% | -1.14% | 13.15% |
| Nifty50 TRI | 4.62% | 4.15% | 6.69% | 7.59% | 15.02% |
Benchmark used: Nifty50 TRI
| 1M | 3M | 6M | 1Y | SI | |
|---|---|---|---|---|---|
| PriceBridge Samvruddhi | 3.06% | 1.00% | - | - | 3.46% |
| S&P BSE 500 (TRI) | 4.27% | 3.72% | - | - | 8.38% |
Benchmark used: S&P BSE 500 (TRI)
Note: 6M and 1Y data will be available as the strategy matures.
| 1M | 3M | 6M | 1Y | SI | |
|---|---|---|---|---|---|
| PriceBridge Top 100 Equity | 3.68% | 3.02% | 5.65% | 4.65% | 9.46% |
| Nifty50 TRI | 4.62% | 4.15% | 6.69% | 7.59% | 11.05% |
Benchmark used: Nifty50 TRI
- Time weighted – Daily valuation method is used for rate of return calculation
- Portfolio valuation is done on the date of any external cash flow with daily weighted cash flows
- Periodic returns are geometrically linked
- Total return includes realized and unrealized gains and income
- Calculations are after deduction of transaction charges
- Trade date accounting is used for calculations
- Accrual accounting is used for fixed income securities; market values include accrued income
- Dividend accrual is used as of ex-dividend date
TIMEMAP™
Risk Insight Across Time Frames—So Actions Stay Disciplined
Interpret cycles, not noise
Actions guided by a framework
Reduce emotional decision-making
RISK AND BEHAVIOUR
Reliable During Volatility. Stable During Uncertainty.
Our investment philosophy emphasizes managing human behaviour, learning via reinforcement, and managing through objectives—built into a data-driven, adaptive platform.
ABOUT
A PMS of Ayan Analytics Pvt. Ltd.
We launched our PMS in Dec 2022 after successfully advising B2B clients as an investment advisory and research house. PriceBridge is principled and pioneered on risk-adjusted returns with time cycle-based proprietary models and has aimed to generate alpha consistently for clients.
Our approach emphasizes managing human behaviour, learning via reinforcement, and managing through objectives—built into a data-driven, adaptive platform.
Our Foundation
in Indian equities
Adaptive investment system
Index stocks and ETFs
Our Vision
Enable investors to build legacy through responsible investing—sustainable, process-led investing designed for long-term outcomes.
FEES
Cost-Aware Structure with Clear Reporting
Competitive rates
Aligned with outcomes
Monthly detailed reports
Nil
None - Investor-friendly structure
ONBOARDING
Simple Onboarding. Clear Process.
Initial conversation about your goals
Identify the right strategy for you
Complete account setup
Start investing with reporting
Schedule a Call
INSIGHTS
Insights on Market Cycles, ETFs, and Investor Behaviour
Why Chasing Returns Fails and Consistency Wins
When Returns Look Good Until They Don’t Nearly 58 percent of investors chase recent high returns.It feels rewarding, until the market reminds everyone who is really in control. Markets rise and fall. That is inevitable. What is avoidable is panic. At PriceBridge, we focus on consistency, not hype. Because emotional reactions rarely build long-term wealth. […]
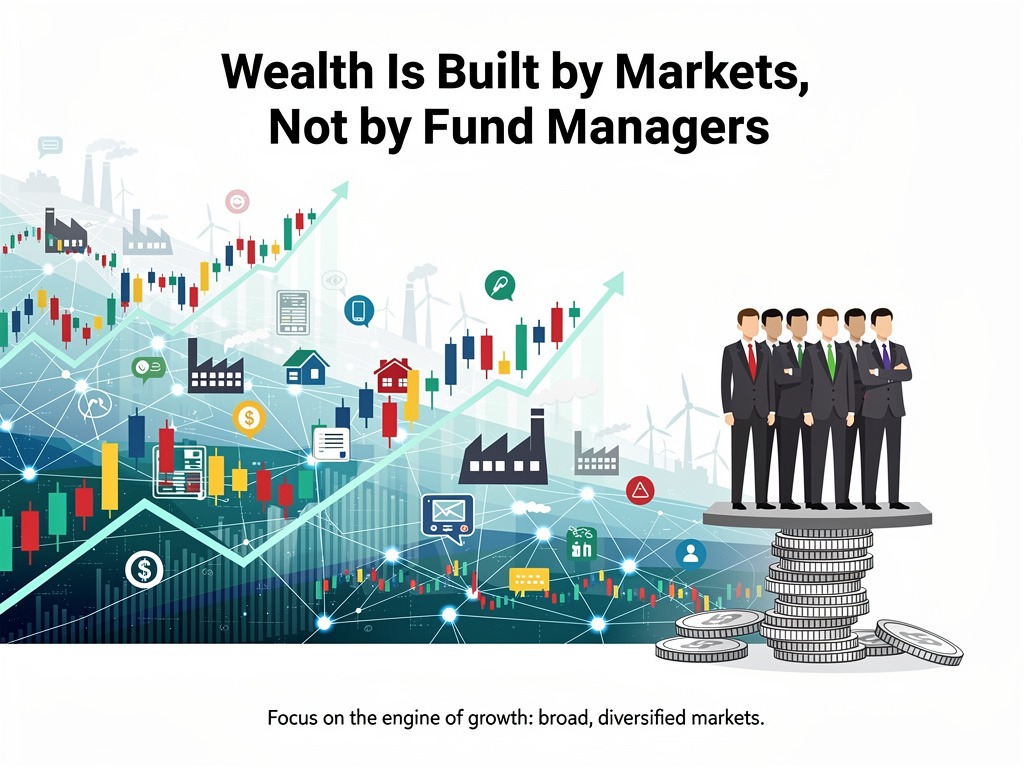
Wealth Is Built by Markets, Not by Fund Managers
A Simple Truth Most Investors Miss Wealth is not created by fund managers.It is created by businesses and markets. Yet many investors spend years searching for the “right” fund manager, believing skill alone will deliver superior returns. The data tells a very different story. According to the SPIVA India 2024 report, nearly 85 percent of […]
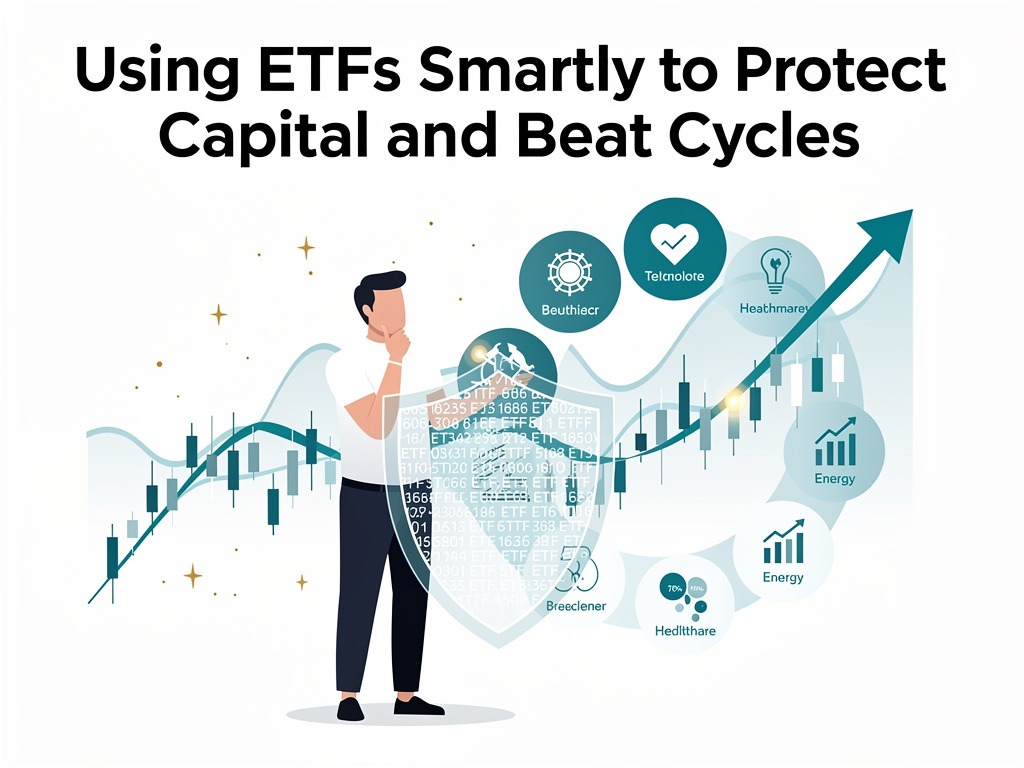
Using ETFs Smartly to Protect Capital and Beat Cycles
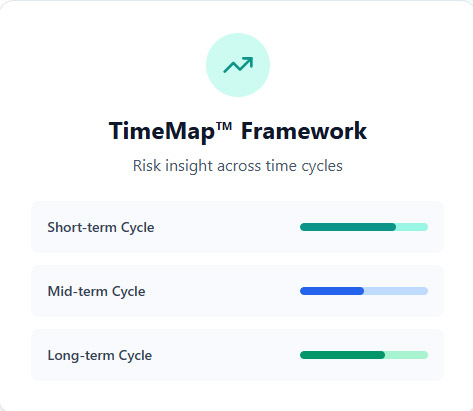
Markets Move in Cycles, Strategies Must Too Imagine it is 2018. Mid-cap and small-cap stocks are under pressure, portfolios are bleeding, and investor confidence is shaken. Many choose to exit, locking in losses. Fast forward to late 2021. Those same segments deliver a powerful rebound, rewarding investors who stayed invested or re-entered at the right […]
FREQUENTLY ASKED QUESTIONS
Have Questions?
Find answers to common questions about our PMS strategies and approach